AI in athletic performance

Author: Yiyang ma
A. Project Description
The author aims at achieving the following goals by using machine learning (ML), artificial intelligence (AI), and Garmin sport watch data:
- Predict the training effect of a Triathlon[1] workout, as measured by average heart rate[2]: heart rate is the prevailing measurement of a distance/endurance training’s effectiveness however there is not adequate research to predict the average heart rate. This study identifies the predictors.
- Predict the athlete’s speed, using time series: athletes spend months of training to improve race-day performance. Workouts can be understood as events indexed by time. This author aims at predicting the average speed, by examining watch’s sensor data, such as history speed, heart rate, and cadence.
- Explore athletic application. The author suggests ways to apply above insights to develop an AI-based training recommendation system. Such a system aims at optimizing race performance and health benefits through realistic workout design and schedule.
The data model includes a total of 3,487 activities (run, bike, and swim) before preprocessing. After data preprocessing, 929 running and 858 biking activities are selected to conduct hear-rate analysis. 582 running and 431 biking activities are selected to conduct speed analysis.
B. Method
B1. Design logic
- Learning tasks and algorithms are identified according to above Project Description:
- To predict Average Heart Rate, the task is to learn the attributes of each existing activity to predict the average heart rate of a new activity.
- To predict speed, the task is to learn individual athletes’ previous speed as indexed by date, to predict the speed in a new activity.
- Following ML/AI algorithms have been identified: multilinear regression (MR), multilayer perception (MLP), random forest, and Long Short Term Memory (LSTM).
- Use Python to implement ML/AI programmatically: multiple python functions are included in a python module named AIAFun.py. AIinRun.py and AIinBike.py use AIAFun.py to analyze run and bike activities, respectively. Dataset has been pre-processed to support learning goals.
- Finally, Athletic Applications are discussed, based on ML/ AI findings above. A recommendation system has been identified to assist athletes in planning training workouts.
B2. Dataset summary
- Raw dataset: 3,487 swim, run, and bike activities are downloaded from Garmin.com by four athletes. The aggregated raw file has 33 features and captures activities between 2017 and 2020.
- Data preprocessing: Since three sports define speed and time differently, the author created the following standardized metrics: ‘TriMaxSpeed(MPH) ‘, ‘TriAvgSpeed(MPH) ‘, ‘Time (Hours) ‘, and ‘Date’.
- Chosen dataset: 929 running and 858 biking activities are selected to conduct hear-rate analysis. 582 running and 431 biking activities are selected to conduct speed analysis.
- Chosen Features: Run and bike share the following features: ‘MaxHR’, ‘AvgHR’, ‘Calories’, ‘Distance (Miles)’, TriMaxSpeed(MPH)’, ‘TriAvgSpeed(MPH)’, ‘Time (Hours)’, ‘RaceFlag’, ‘AthleteID’, ‘ElevGain’, ‘ElevLoss’, ‘MinTemp’, ‘Date’. Run has 3 additional features: ‘AvgRunCadence’, ‘MaxRunCadence’,’AvgStrideLength’.
- Extra features: Swim is out of scope however its features have been pre-processed and included. The file also includes features that are not used in the ML/AI functions: e.g. AerobicTE, Title.
B3. ML/AI Algorithms
Above learning goals can be implemented through linear regression models, neural networks, and other time-proven ML/AI models. The following sections summarize run analysis and bike analysis, respectively.
C. ML/AI Analysis: Run
C1 Learn to predict Average Heart Rate (avgHR) through Regressions and Neural Networks
Dataset: 929 instances of runs with heart-rate data; 15 features each.
Table 1: ML/AI Algorithms (Run)
| # | ML/AI | Purpose | R2 | RMSE | Comment |
| 1 | Multilinear Regression | Explore the correlation between AvgHR and relevant attributes after remove instances without heart rate | Avg: 0.60
Std dev: 0.06 |
Avg: 11.32
Std dev: 1.43 |
|
| 2 | Simple-Linear Regression | Explore the relationship between each individual predictor and AvgHR.
Visualize the correlation to build intuition. |
TriAvgSpeed(MPH): 0.38 with
Coefficient 8.76 AvgRunCadence: 0.31 with Coefficient 0.60 |
TriAvgSpeed(MPH) : 226.83
AvgRunCadence: 249.39
|
Experimented all predictors but ONLY report 2 attributes of highest R2
Reference Chart 1 |
| 3 | Random Forest
|
Implement random forest, a time-proven means of predicting linear targets | 0.64 | 10.81 | Random Forest is the ML algorithm of best R2 & RMSE |
| 4 | AdaBoost | Implement time-proven means of predicting targets | Avg: 0.59
Std dev: 0.04 |
Avg: 11.66
Std dev: 1.16 |
|
| 5 | K Nearest Neighbor (KNN) | Implement time-proven means of predicting targets | Avg: 0.24
Std dev: 0.09 |
Avg: 15.75
Std dev: 2.21 |
|
| 6 | Multilayer-Perception (MLP) | Explore the use of Neural Network in predicting heart rate | Avg: 0.04
Std dev: 0.01 |
Avg: 20.43
Std dev: 1.52 |
First NN in this study. |
Simple-linear Regressions: Below visualizes average heart rate’s correlation with running speed and cadence, respectively:
Chart 1: Simple-linear Regressions (Run)

LASSO Feature Selection: After the experiments above, the author explored LASSO, a proven technique of feature selection. According to LASSO, Time (Hours), AvgStrideLength, and RaceFlag are not statistically significant in predicting the Average heart rate. Since RaceFlag is not significant, this seems to suggest that athletes are not going to exert an excessive amount of effort in the race event, in comparison to regular training. Finally, LASSO feature selection does not improve ML performance. In fact, Multilinear regressor and random forest (after LASSO feature selection) appear to have a slightly lower R2.
C2 Learn to predict running speed through RNN[3]
Previous speed can be utilized to predict the speed of a future run. The author has pre-processed time-indexed speed data to generate 582 instances (from one athlete). A baseline model using a simple average of previous runs’ speed is implemented (Chart 2). An RNN model, specifically a LSTM model has been implemented (Chart 3). Based on visual inspection, LSTM does not outperform the baseline.
Chart 2: Baseline Time-series Model (Run) Chart 3: RNN Time-series Model (Run)
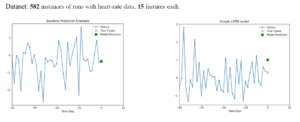
Dataset: 582 instances of runs with heart-rate data; 15 features each.
C3 Preliminary athletic applications
- To increase the average heart rate and therefore level of training, the athlete (runner) should focus on running speed and running cadence. Other drivers are not essential, including length of the stride.
- The speed of the run can be predicted using time-series, per the LSTM model above. However, the current model’s performance is less than satisfactory. It would be important to include other features to experiment a multivariate LSTM model.
D. ML/AI Analysis: Bike
D1. Learn to predict Average Heart Rate (avgHR) through Regressions and Neural Networks
Dataset: 858 instances of bike activities with heart-rate data; 10 features each.
Table 2: ML/AI Algorithms (Bike)
| # | ML/AI | R2 | RMSE | Comment |
| 1 | Multilinear Regression | avg: 0.51
std dev: 0.06 |
avg: 15.13
std dev: 1.61 |
4th Highest R2 |
| 2 | Simple-Linear Regression | TriMaxSpeed(MPH): 0.11
AthleteID: 0.21 |
TriMaxSpeed(MPH) : 367.94
AthleteID: Residual sum of squares: 328.79 |
|
| 3 | Random Forest | 0.74 | 10.96 | Highest R2 |
| 4 | AdaBoost | avg: 0.58
std dev: 0.04 |
avg: 13.96
std dev: 0.52 |
2nd Highest R2 |
| 5 | K Nearest Neighbor (KNN) | avg: 0.53
std dev: 0.06 |
avg: 14.72
std dev: 1.36 |
3rd Highest R2 |
| 6 | Multilayer-Perception (MLP) | avg: 0.03
std dev: 0.02 |
avg: 21.93
std dev: 2.78 |
Like the analysis on run dataset, Random Forest (with a R2 value of 0.74) has the best performance among all algorithms. AdaBoost is ranked 2nd best by R2. KNN takes over MR as the third best. MLP has been the lowest performing algorithm in both run and bike analyses.
Simple-linear Regressions: Unlike run analysis, there is not a single-linear regressor that generates a R2 higher than 0.3. Two best single-linear regressors, as shown below are Maximum Speed and the Athlete who conducts the activity (AthleteID). It is notable that only three of the four athletes have provided bike data. We will discuss the size of samples in the next section.
LASSO Feature Selection: Like run, there is no evidence of performance improvement if only statistically significant features are included.
Chart 4: Simple-linear Regressions (Bike)

D2. Learn to predict running speed through RNN[4]
The RNN based time series analysis has yielded the result below. It appears that, in comparison to run, bike RNN has a prediction closer to true future. This hypothesis requires further examination.
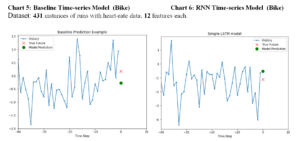
Dataset: 431 instances of runs with heart-rate data; 12 features each.
D3. Preliminary athletic applications
- Speed of the activity is the most significant predictor of the average heart rate. This is consistent with run analysis. However only 10 features are used to predict the average heart rate; and the features do not include well-known athletic metrics such as revolutions per minute (RPM).
- Though athlete ID has been shown as a predictor, it is premature to conclude that the participating athletes have more speed difference in bike than run. The major limitation is the small size of the sample; missing one athlete’s bike data may have also skewed the statistical significance.
- Bike as a sport depends very much on road conditions and the sport gears in use. Future models ideally should include relevant datapoints to improve the model’s performance.
E. ML/AI Analysis: Findings from Both Sports
The pilot dataset is admittedly small which may have impacted the performance of Neural Networks. Despite size, Random Forest has shown high prediction accuracy in run (R2=0.64) and bike (R2= 0.74). This seems to suggest that different algorithms have different requirements of the dataset size, which has been a well-known phenomenon in ML/AI.
RNN has demonstrated promising result through a single-variant, LSTM model. It is possible that a multi-variant LSTM model will outperform it.
Besides the need to expand number of data instances. Both analyses seem to require other data features that are not yet provided by the Garmin Sport watch. For those datapoints that are already provided, significant level of effort must be invested to preprocess the data. This can be another area to improve and automate for scalability.
F. Due Diligence
F1a. Opportunities in Training Improvement
The preliminary analysis shows promising evidence that ML /AI can be fine-tuned to predict the heart rate and speed of the athlete in Bike and Run. This creates a potential to generate individual training advices for Performance Improvement and Injury Prevention since the users can plan their workouts according to desired race-day speed and heart rate targets, based on individual training history. A personally optimized ML/AI algorithm may outperform the traditional programming in the existing applications. Related use cases include nutrition planning since the consumption of calories are directly related to training efforts. This may complement the existing solutions that leverage “webpage-crawling” to but does not use individual datapoints or AI (Mihnea Donciu et al[5]).
F2b. Opportunities in Immunology
Cardiovascular exercises including run, bike, and swim are known for benefits to individuals’ overall health including their immune systems. For example, Zhen Yan, a University of Virginia researcher stated that “medical research findings strongly support the possibility that exercise can prevent or at least reduce the severity of ARDS, which affects between 3% and 17% of all patients with COVID-19.”[6] According to Yan: “our muscles naturally make EcSOD (an antioxidant), secreting it into the circulation to allow binding to other vital organs, but its production is enhanced by cardiovascular exercise”. However, Paolo Maria Matricardi et. al pointed out “even the SARS-CoV-2 can then spread more easily to the deepest areas of the lungs during strenuous exercise, and there start its aggressive action”. This suggests that athletes who inhale much air during exercises may have higher risks in immunity.
Studying the athlete’s average heart rate may help predict the increase of immunity (if the correlation between ExSOD and average heart rate can be quantified) and also suggests an upper limit given the individual’s amount of air inhaled in a workout, which may be inferred by the average hear rate[7].
F2a. Technical Risks
Computing power and dataset size must expand in the comprehensive research and the production environment. In this report, the size of dataset may have limited the effectiveness of neural networks. Other technical risks include the lack of medical evidence in inferring health impact, as this depends on progress in the medical field. Also, the sensors’ types, quality, and availability will limit the features that ML/AI solutions can capture. A combination of machine generated data and user inputs may help mitigate this risk.
F2b. Ethical and Market Risks
Privacy risks are relatively low, since all data is anonymized, and analytics are accessible only by individual users. However if the dataset is intended for medical use, or even obtaining an FDA-approval, then the risk of data quality and recommendation quality will be high. Another risk is the overlaying of sport data with other potentially sensitive datapoints such as the athletes’ personal information and medical records, if such needs emerge during the implementation of the project.
Competitor threat is realistic, if this product directly competes with dominant sport companies (e.g. Nike) who[8] deploy neural network-based recommendation systems. It would be important to identify the niche market segments that this ML/AI solution should target.
F3. Productization
A deeper market research should be conducted before commercialization. A reasonable next step is to review the research so far with participating athletes for user inputs. If the research can be published on a credible academic journal, it may attract more user interests.
Given the dependency on watch hardware and software, this AI/ML solution may best be implemented with a partner manufacturer so that the optimal types and numbers of features can be selected and reflected in hardware and software design. Another potential solution is to partner with 3rd party training platforms such as TrainingPeaks and Strava, by positioning this solution as a premium service that users may subscribe to.
Finally, if the ML/AI market potential attracts enough funding, a specialized hardware could be designed to ensure the seamless integration with ML/AI. In this scenario, the product can be a combination of hardware sales and software analytical module. This is in fact a model in indoor bike trainer market, as demonstrated by companies like Wahoo.
G. Conclusion and Way-forward
In this study, the author shows the potential of using ML/AI to predict the average heart rate in an activity. Random Forest has shown high prediction accuracy in run (R2=0.64) and bike (R2= 0.74). This study also shows that RNN can be deployed to predict race speed, based on the previous speeds.
In a future follow-up study, an expansion of sample size is expected to improve the effectiveness of Neural Networks (including MLP and RNN). An increase of features may also improve the performance of prediction. Despite the limitations, this study proves that the average speed of the athlete is the predictor of the average heart rate in an activity.
Market research /literature review has revealed current market needs of providing personalized recommendations to athletes and proven early success on both AI-based and traditional software solutions. However, there seems to be unsatisfied market demand, that can be addressed by AI-based solutions. Specifically, the author identified three athletic/commercial opportunities:
1) An athlete recommendation system for training intensity (e.g. running speed).
2) A recommendation system for nutrition intake.
3) A training system to improve the athlete’s immunity if complementary medical research is available.
Given the large date requirements and potential needs of customizing hardware design, this ML/AI solution may warrant a strategic partnership with a major manufacturer of sport wearables, or a third party sport data processor, or significant funding from potential investors.
[1] Triathlon is a multi-sport activity that includes three sports: swim, bike, and run. In this study, the author explores bike and run.
[2] Though not studied in this project, training distance is another key factor of training effect. This can be explored in future studies.
[3] RNN model is adapted from https://www.tensorflow.org/tutorials/structured_data/time_series
[4] RNN model is adapted from https://www.tensorflow.org/tutorials/structured_data/time_series
[5] Mihnea Donciu et al. “The Runner – Recommender system of workout and nutrition for runners”. 2011 13th International Symposium on Symbolic and Numeric Algorithms for Scientific Computing
[6] Barney, Josh. EXERCISE MAY PROTECT AGAINST DEADLY COVID-19 COMPLICATION, RESEARCH SUGGESTS. University of Virginia. Accessed May 9th, 2020. https://news.virginia.edu/content/exercise-may-protect-against-deadly-covid-19-complication-research-suggests
[7] M.S. Bianchim et al. Correlation between heart rate variability and pulmonary function adjusted by confounding factors in healthy adults. Braz J Med Biol Resv.49(3). 2016PMC4763812
[8] Richa Khandelwal /Nike Engineering. Serving Athletes* with Personalized Workout Recommendations. Medium.com. Accessed May 9th, 2020. https://medium.com/nikeengineering/serving-athletes-with-personalized-workout-recommendations-285491eabc3d
s